Jakob Wolfram talks about how water quality in Europe changed over time for different species groups and identifies the actors responsible for the deteriorated water quality. His research on “Water Quality and Ecological Risks in European Surface Waters – Monitoring Improves While Water Quality Decreases” is published in Environment International.
As you may have learned from Part 1 of the blogpost series, organic chemicals are widely used: in industrial processes, agriculture, and private households. In Part 2 of this series, I will highlight which organism groups are most acutely at risk, which chemicals are most detrimental, and how environmental risks occurred over time.
Did you miss out on Part 1? We introduced the monitoring data set which we analysed to deduce the status and trends of European freshwater integrity. Read part 1 here to find out how organic contaminants occurred over 15 years across 31 countries, and to learn about the challenges associated with accurately capturing these concentrations.

Many chemicals – any risk?
Do all these organic contaminants actually pose any noteworthy risks? Not all of them! After we assessed how chemicals occur over time, the next step was to evaluate if their concentrations are actually detrimental to aquatic ecosystems in Europe. We derived so-called “regulatory threshold levels” (RTLs) for 3 organism groups (invertebrates, fish, and aquatic plants) and the combined ecosystem (i.e., the most sensitive RTL per substance). Generally, if RTLs are exceeded, then there is an acute risk, i.e. even a short-term exposure impairs organism. If you are interested how we automated this process to assess large suites of chemicals ecotoxicologically, then check out Lara’s post. To keep this post simple, you also need to know that an “MRAA” should be understood as the most toxic concentration for an organism group at a location in a given year.
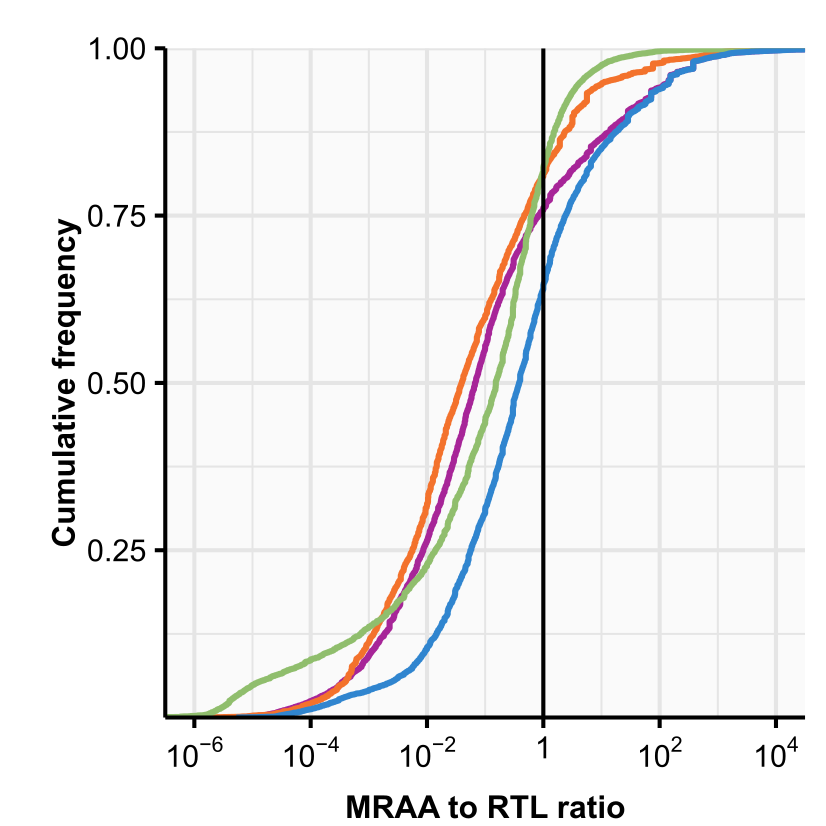
We found that around 35% of MRAAs exceeded their RTLs, thus it is a common occurrence that organic contaminants pose acute risks to freshwaters throughout Europe. There are differences between organism groups (see Figure 2), with aquatic invertebrates experiencing the highest (23.9%) and aquatic plants the lowest risks (17.8%). As a result, 38.2% of all water bodies (n = 7,227) did experience at least one adverse event during the last 15 years. Now that we got a general understanding of the frequency of risk, it is time to look at the actors responsible for it.
Which chemicals are responsible?
Who’s at fault? It depends! When we looked at the entire ecosystem, we found that pesticides are the main chemical agents responsible for 85% of RTL exceedances (Figure 3c). This was followed by industrial chemicals (10.9%) and numerous other chemicals (5.2%). Pesticides are introduced primarily via agricultural pest control measures but there are also several non-agricultural sources of these pesticides, such as private and industrial use, or weed control of public infrastructure (railways, parks, etc.). Thus, there is still a lot to do when it comes to curbing the introduction of pesticides into freshwater systems, given that they are so dominant on the overall risk. However, this can also be seen as an opportunity: If we can reduce the application of pesticides or their subsequent transport into aquatic systems, then we could greatly improve the chemical quality of many surface waters throughout Europe.
When taking a closer look at the specific risks for those different organism groups, we also found that different chemical classes are most relevant here (Figure 3). For aquatic invertebrates, insecticides define risks (>90%, c.f. Figure 3a,c); in contrast, aquatic plants are at risk from herbicides and industrial chemicals (c.f. Figure 3c,d). Such effects are expected, because herbicides are designed to impact primarily plants whereas insecticides have modes-of-action that are shared across most invertebrates. Thus, when we want to assess environmental risks, we always have to keep in mind for which organism (group) we want to draw conclusions on. If you want to get a better idea which chemicals can be detrimental in European surface waters, then compare Figure 3 a,b,d,e.

Time is of the essence
How did risks evolve over time? They mostly increased! We analyzed the temporal trends of risks throughout Europe and found two general trends: For aquatic plants and the combined ecosystems, the environmental risks were practically unchanged over time (Figure 4). For aquatic invertebrates and fish (Figure 4a,b), risks increased significantly over time, signaling that for those two organism groups the chemical conditions did deteriorate. As we discussed earlier, this can be attributed to the presence of insecticides in those water bodies. However, it’s also important to note that it is extremely difficult to differentiate between two major scenarios: we could observe increasing risks because contaminants are transported more frequently and in higher concentrations into surface waters (see also Part 1). Alternatively, monitoring could have improved (as we have seen in Part 1), thus detecting contaminants more frequently and in higher concentrations, although the contamination events – in reality – remained unchanged. Within the second scenario, only our ability to uncover risks would have improved, while “true” risks remained unchanged. Currently, we cannot give you a definite answer on this highly complex question, but it is a central question that needs to be explored further in the future.
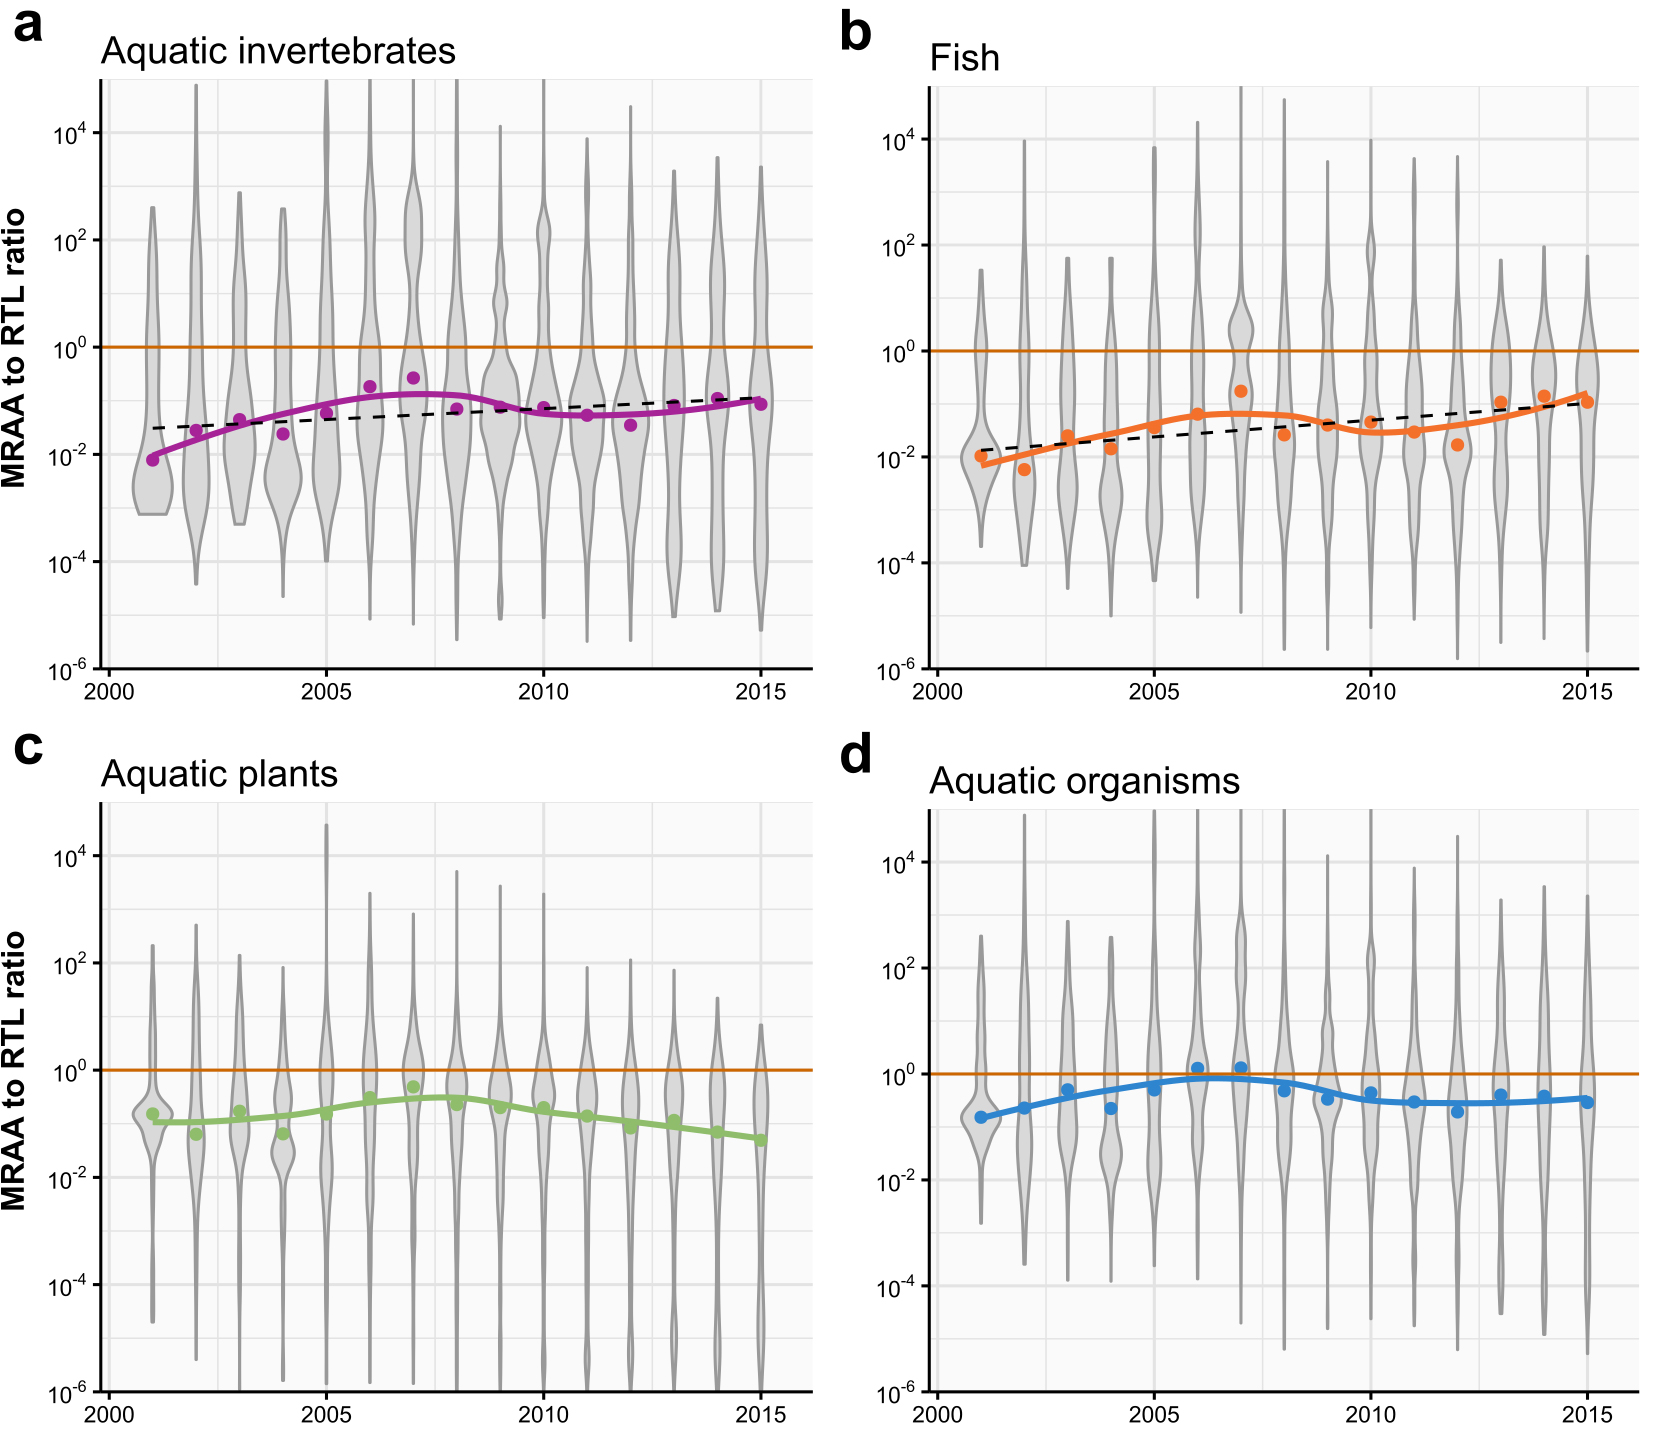
That said, our analyses clearly show that water quality did not improve significantly over time – rather, we remain at a standstill, or worse, we regressed in some aspects. One positive aspect that needs to be noted though, is that Belgium was actually able to significantly reduce the toxicity in surface waters for all organism groups, demonstrating that environmental protection and management can be successful.
Large data – high complexity
As we showed, assessing risk on continental scales is a complex and challenging exercise; therefore I highly encourage you to read the publication, as we only scratched the surface of the results in this blogpost. Still, there are three things you can take away from this blog:
- Environmental risks change over time
- Risks are distributed differently depending on the organism (groups) in question
- The spatial context plays a critical role
Stay tuned for part 3 which will go into more detail on the spatial dimension how it affects risks, how land-use influences the introduction of organic contaminants, and other aspects of the hydrological network in Europe.
This work was done as part of the research team “Meta-analysis of Global Impacts of Chemicals” (MAGIC) and if you are interested in our work, you can get in touch.
The paper was published by Jakob Wolfram, Sebastian Stehle, Sascha Bub, Lara Petschick, and Ralf Schulz in Environment International. Additionally, some interactive analyses (chemical association networks and Sankey-diagrams) can be accessed online. Figures are reprinted with permission from Elsevier 2021 (CC-BY licence).