Jakob Wolfram talks about how water quality in Europe is affected by spatial factors and how they contribute to quality impairments for different organism groups. His research on “Water Quality and Ecological Risks in European Surface Waters – Monitoring Improves While Water Quality Decreases” is published in Environment International.
As you may have learned from part 1 and 2 of the blogpost series, organic chemicals are widely used: in industrial processes, agriculture, and private households. In Part 3 of this series, I will highlight how risks are distributed spatially in Europe, how these patterns differ between organism groups, and how anthropogenic land-use plays a critical role in organic contamination.
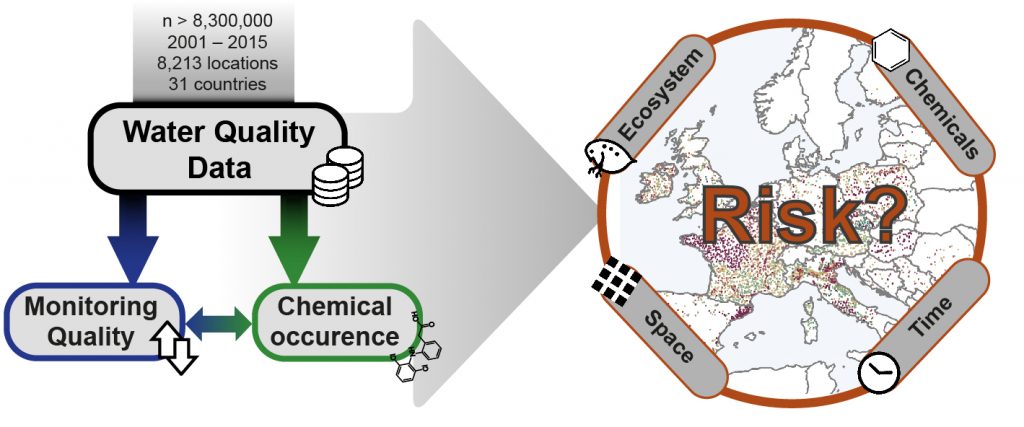
Did you miss out on Parts 1 and 2? In Part 1, we introduced the monitoring data set which we analysed to deduce the status and trends of European freshwater integrity. In Part 2, we provided further context about the impact of different chemicals and the change of water quality over time.

Frequent risk – any patterns?
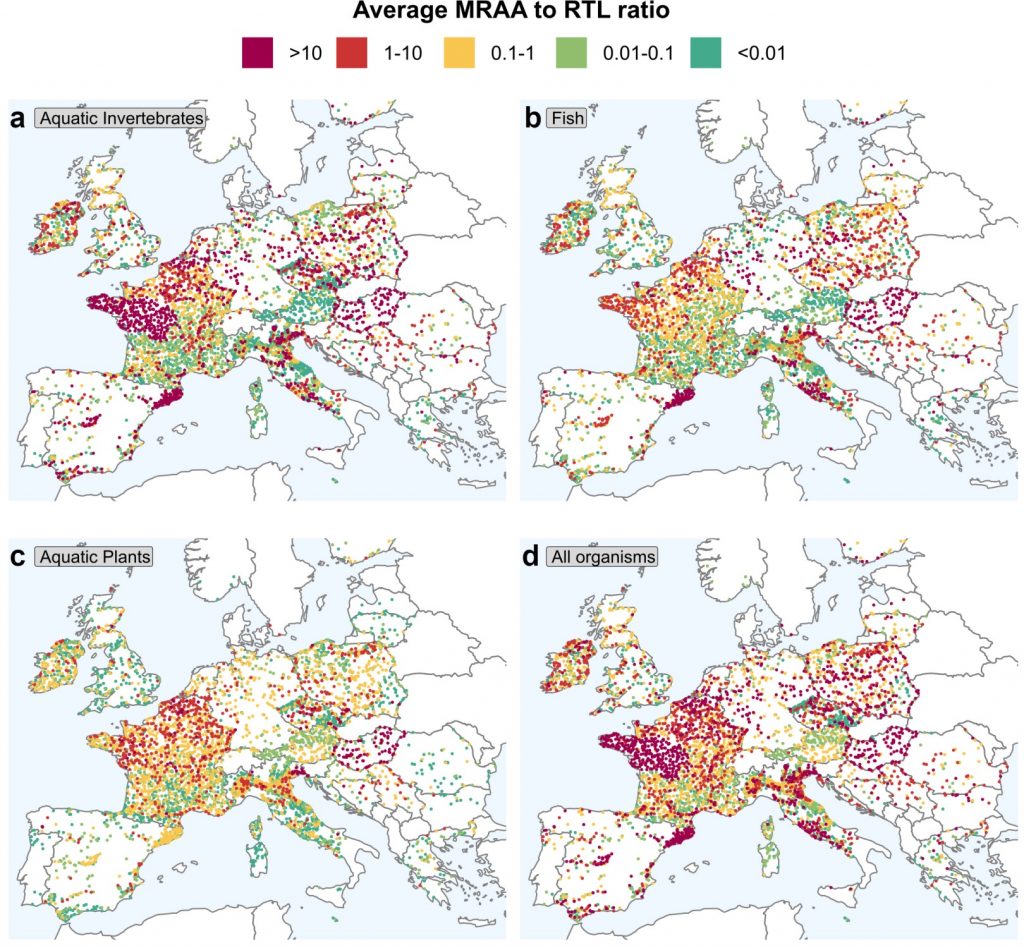
Does organic contamination occur uniformly in Europe? Not at all! After we assessed the risk of organic contaminants over time, it is time to look at the spatial aspects. Risks were assessed using MRAA to RTL ratios, i.e. we compared concentrations in the water phase (MRAA) with their regulatory threshold levels (RTLs). If you are unfamiliar with the concept, I encourage you to read Part 2 of the series, which introduces the concept.
We found that 38.2% of all 7,227 water bodies did experience at least one adverse event during the last 15 years. When looking at the average risk over time across Europe (see Figure 2), then we see different patters emerging. Primarily, looking at all organism groups combined (Figure 2d), we can see that in most regions there are at least sporadic exceedances (expressed as average MRAA to RTL ratios), and some regions show very frequent risks with most monitoring stations recording adverse events. Thus, ecological risks aren’t exclusive to certain countries but a pan-European phenomenon.
Moreover, risks vary among organism groups. When comparing aquatic invertebrates (Figure 2a) with fish (vertebrates, Figure 2b) or aquatic plants (Figure 2c), it becomes evident that risks aren’t only distributed differently in space but they also differ considerably between organism groups. As you may have learned in Part 2, various organisms are susceptible to different organic chemicals and these physiological differences translate into spatial patterns of risk, due to changing contamination patterns.

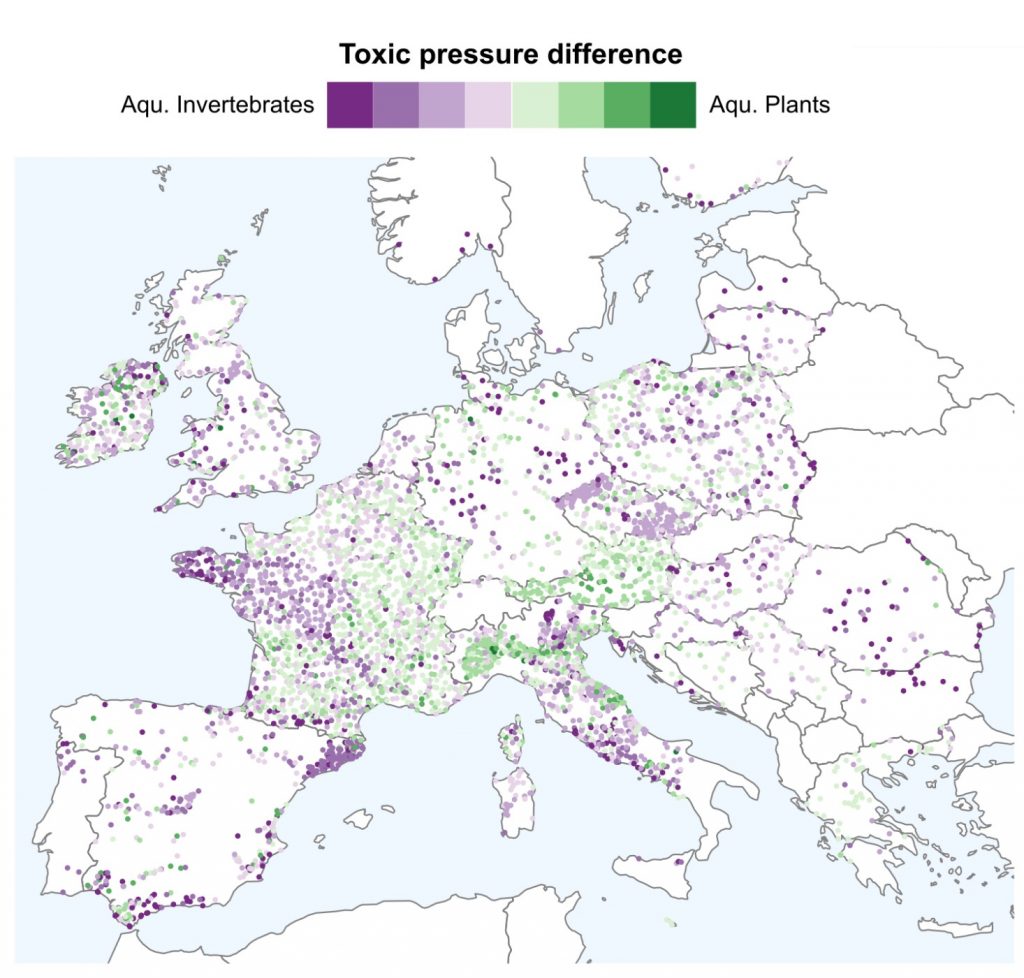
To make this comparison a bit easier, Figure 3 shows how toxic pressures (the MRAA to RTL ratio) differ spatially between aquatic invertebrates and plants. The more purple a dot is, the higher the risk for aquatic invertebrates compared to aquatic plants; the greener a dot, the opposite applies. So, you can see that there are certain regions where we see comparatively high risks for aquatic invertebrates, such as coastal regions in Spain, western France, and southern Italy. Especially in Spain, these regions with purple dots are characterized by intense agriculture, and the crops grown there (e.g., citrus farms, orchards, olive groves) require frequent use of insecticides that are highly toxic to invertebrates (see Part 2). Conversely, northern parts of Italy (around Piedmont) are also intensified agricultural regions but show higher risks for aquatic plants (Figure 3), which may suggest that herbicides are most frequently transported into surface waters, due to the grown crops there.

What role does the landscape context play?
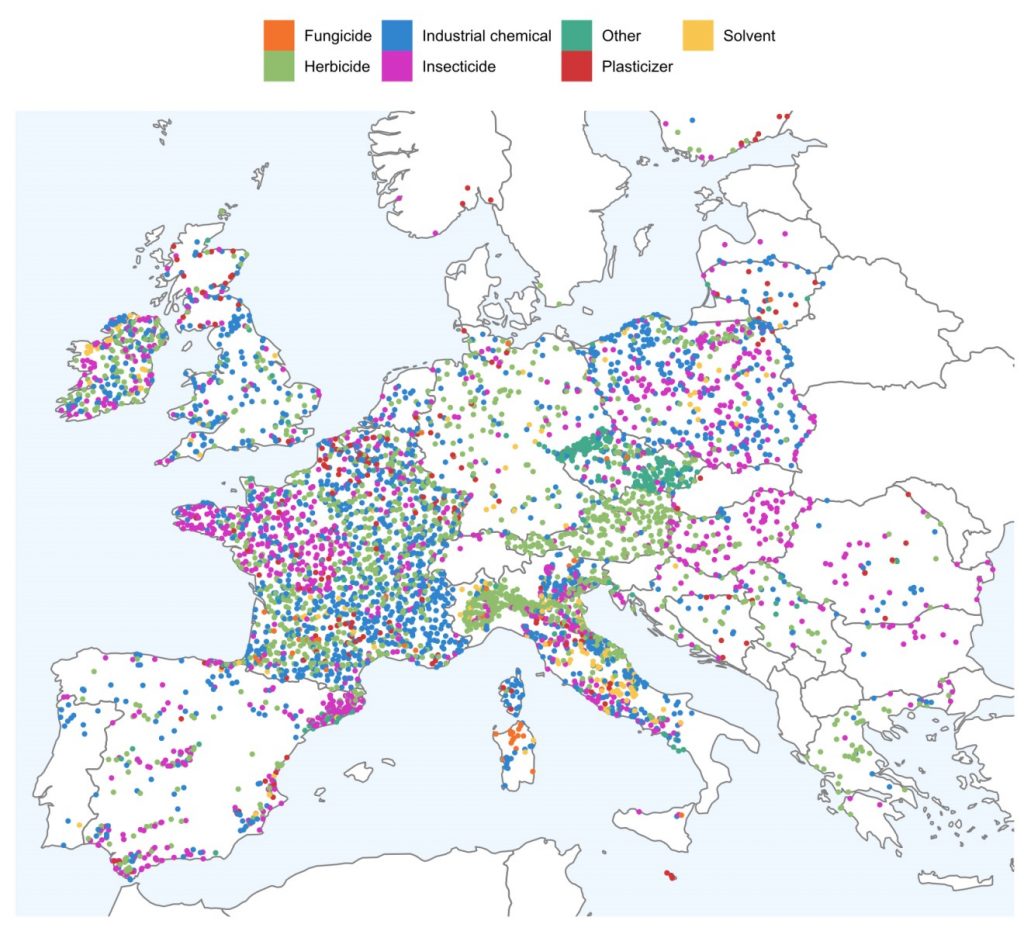
Who’s at fault? It depends! We hypothesized that landscape context influences which chemicals occur and what the associated distribution patterns are. Now it is time to look at which chemicals define risks at these sites (Figure 4). For those coastal parts of Spain, insecticides are in fact the dominant chemical class driving risks and, in some instances, industrial chemicals as well, which likely originate from urbanized sources. For the Piedmont region in northern Italy, herbicides were the dominant chemicals responsible for the high toxic pressure towards aquatic plants (see Figure 4). As you can see, the landscape context, such as crop distributions, is vital in explaining these large-scale risk patterns but there are also drawbacks you have to be aware.
You may remember from Part 1 of this series that the data had considerable heterogeneity issues, i.e. some countries conducted significantly lower quality monitoring which impacted their ability to find contaminants. Based on looking at the map in Figure 4, you may think that throughout Austria herbicides are mainly responsible for water quality impairments. While this may be true, Austria also did comparatively worse monitoring than many other countries, only probing for a select few substances (data not shown). Their monitoring lacked testing for several important insecticides and industrial chemicals, thus it may be possible that we are missing major contamination events relevant for aquatic invertebrates and fish. This is an important reminder to always check for your data’s drawbacks and limitations, especially in such complex research questions (see also our discussion in Part 1).

Agriculture at fault?
We have talked repeatedly about the impact of major pesticides on those environmental risks in Europe. You may ask yourself if agricultural practices are the only thing that matters in this macro context? To address this, for most of those monitoring stations (88.3%, n = 7,249), we derived the actual drainage basins and analyzed the land-use therein. It became evident that the most relevant spatial attribute was the intensity of agricultural land-use (i.e., % agricultural land-use in the catchment). In Figure 5 you can see how for all organism groups but fish, we see a clear relationship between agricultural intensity and the average aquatic risks (colored regressions). This relationship was most pronounced for aquatic plants, as average risks differed by nearly 2 orders of magnitude between low and high-intensity watersheds. But you can also see how often pesticides defined those risks depending on the agricultural land use (Figure 5, dotted line). Even in watersheds dominated by agriculture (>85% agricultural land-use), pesticides only contributed between 60-80% of RTL exceedances. Thus, point-sources, such as wastewater outlets, wastewater treatment plants, and urban storm drainages, can still substantially define aquatic risks in these situations, introducing industrial chemicals, solvents, flame retardants, pharmaceuticals, and other substances (see Part 2).

Pesticides are the prime cause for reduced water quality in Europe, but it would be negligent or spurious to simplify this complex issue by solely focusing on this contaminant group. Many other organic contaminants contribute to the water quality impairments that we have discussed in this three-part series and they require equal attention to pesticides. Our knowledge of toxicities for pesticides is already advanced compared to all other contaminant groups; and particularly for industrial chemicals and pharmaceuticals we are faced with data gaps that currently hinder comprehensive risk assessments. Thus, it should be our objective as ecotoxicologists to further uncover these chemicals’ occurrences, fate, and (eco)-toxicological properties to better understand large-scale environmental shifts.
To conclude this blog series, I hope that you learned more about:
- Critically evaluating the limitations of your datasets
- Quantifying heterogeneity issues and the quality of monitoring
- Environmental risks for different organism groups
- Chemical classes most relevant for risk in European surface waters
- How risks may change over time
- The importance of the spatial context
- The interaction of chemicals × organisms × space × time
I encourage you to read the publication, as we discuss further aspects and go into more detail. This work was done as part of the research team “Meta-analysis of Global Impacts of Chemicals” (MAGIC) and if you are interested in our work, you can get in touch.
The paper was published by Jakob Wolfram, Sebastian Stehle, Sascha Bub, Lara Petschick, and Ralf Schulz in Environment International. Additionally, some interactive analyses (chemical association networks and Sankey-diagrams) can be here. Figures are reprinted with permission from Elsevier 2021 (CC-BY licence).
